Log in to submit your own samples!
Plot a Pie Chart
Problem by oml1111
| # | Likes | Tech tags | Title | Creator | Created date |
|---|---|---|---|---|---|
| 1 | 0 |
Matplotlib
|
2022-12-17 02:41
|
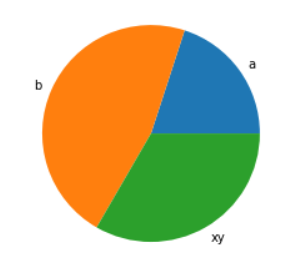
Renders the following pie chart:

Code
import matplotlib.pyplot as plt

plt.pie([3, 7, 5], labels=["a", "b", "xy"])
plt.show()
Further reading
References
| functions | |
matplotlib.pyplot.pie |
matplotlib.org |
matplotlib.pyplot.show |
matplotlib.org |
Problem Description
Plot a categorical bar graph containing at least 3 labeled slices. Include a picture of the graph in the specification.