Log in to submit your own samples!
Slider on a Line Graph
Problem by oml1111
| # | Likes | Tech tags | Title | Creator | Created date |
|---|---|---|---|---|---|
| 1 | 0 |
Bokeh
|
2022-12-17 03:57
|
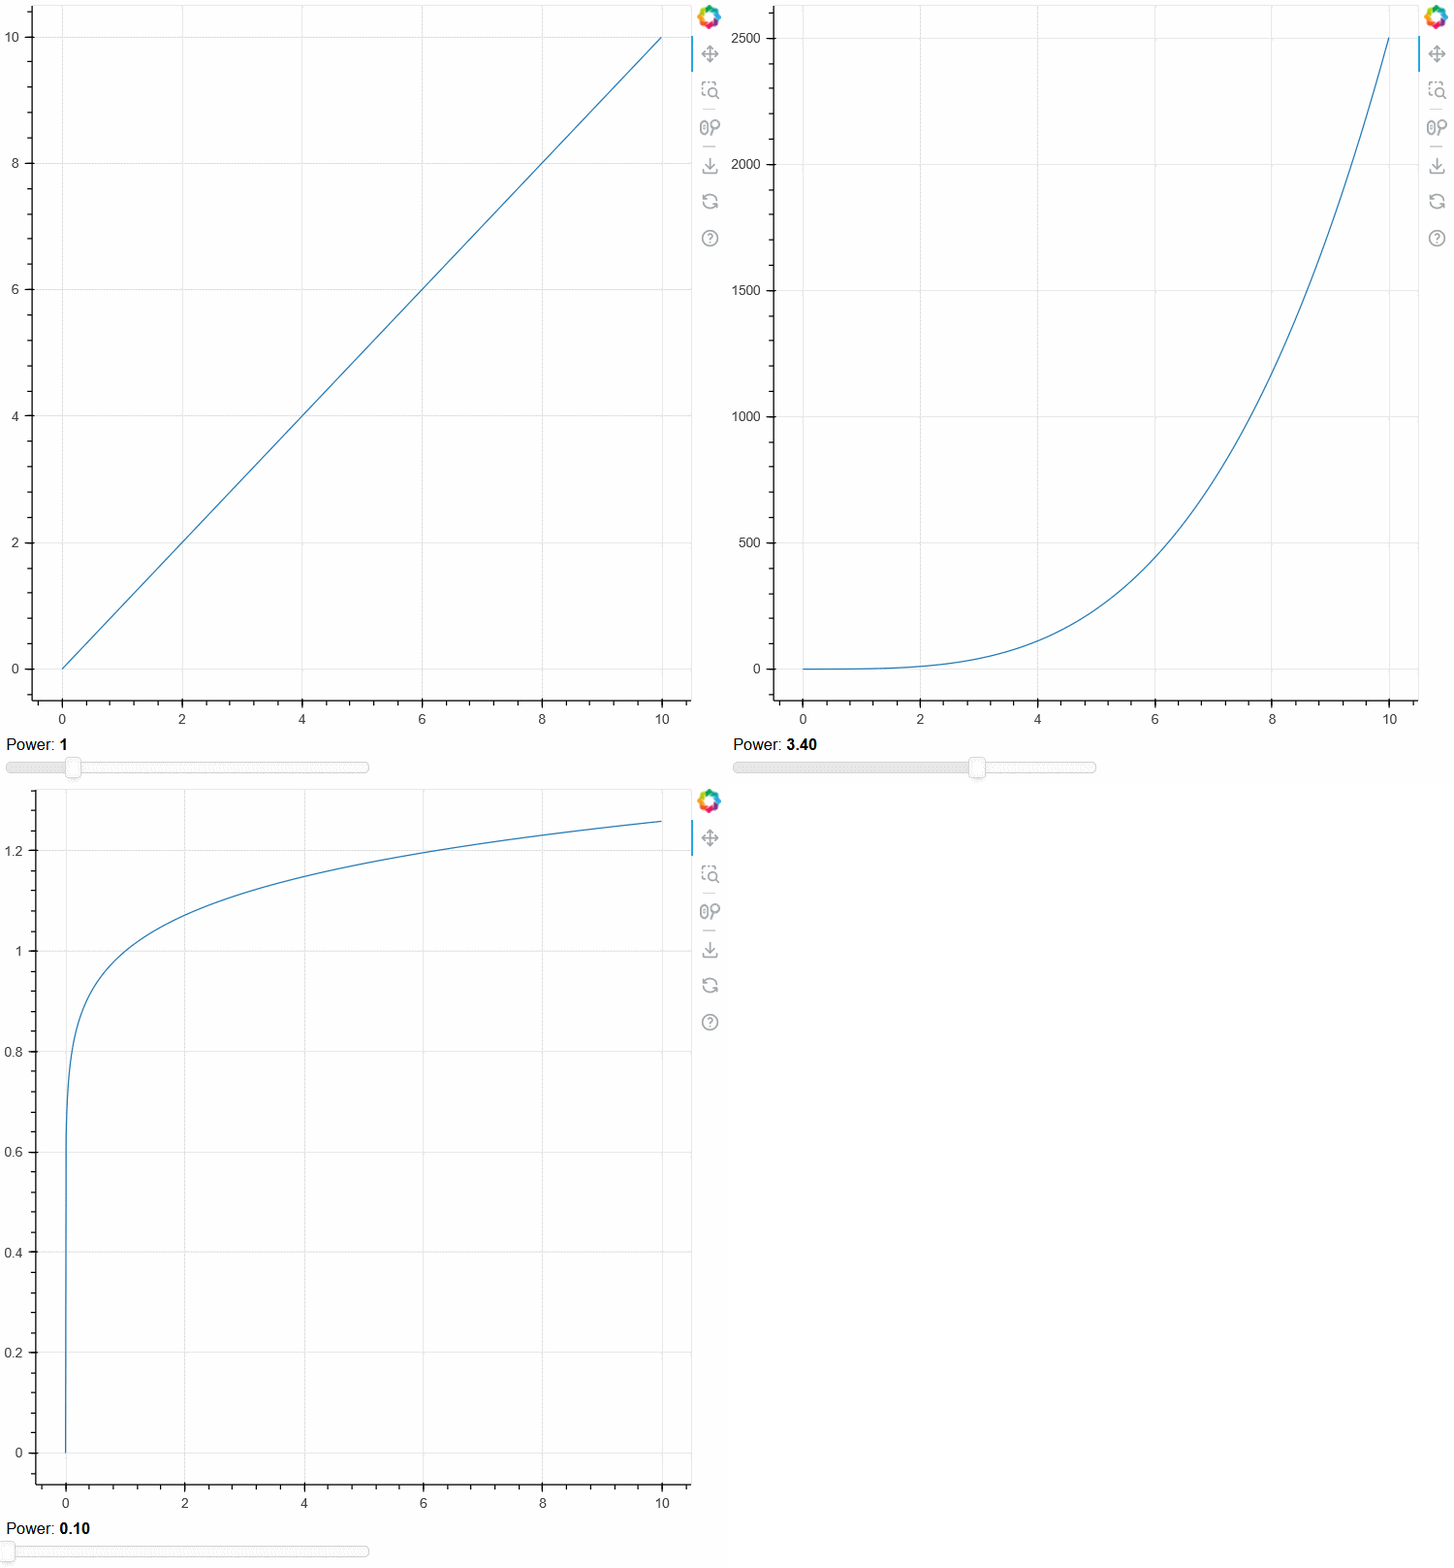
Here we plot a graph of \(y = x^k\) where the value of \(k\) can be adjusted with a slider. Bokeh allows us to specify the effects of our interactions through Javascript, and that's what we do here.

Code
from bokeh.layouts import column
from bokeh.models import CustomJS, Slider, ColumnDataSource
from bokeh.plotting import figure
from bokeh.io import show

source = ColumnDataSource(data=dict(x=[x/100.0 for x in range(0, 1000)], y=[x/100.0 for x in range(0, 1000)]))

plot = figure()
plot.line('x', 'y', source=source)
power_slider = Slider(start=0.1, end=5, value=1, step=.1, title="Power")

callback = CustomJS(args=dict(source=source, power_slider=power_slider),
                    code = """
    const x = source.data['x'];
    const y = source.data['y'];
    for(let i = 0; i < x.length; i++) {
        y[i] = Math.pow(x[i], power_slider.value);
    }
    source.change.emit();
""")

power_slider.js_on_change('value', callback)

show(column(plot, power_slider))
Further reading
References
| functions | |
bokeh.io.show |
docs.bokeh.org |
bokeh.layouts.column |
docs.bokeh.org |
bokeh.models.CustomJS.js_on_change |
docs.bokeh.org |
bokeh.plotting.figure.line |
docs.bokeh.org |
range |
docs.python.org |
| classes | |
bokeh.models.ColumnDataSource |
docs.bokeh.org |
bokeh.models.CustomJS |
docs.bokeh.org |
bokeh.models.Slider |
docs.bokeh.org |
bokeh.plotting.figure |
docs.bokeh.org |
dict |
docs.python.org |
Problem Description
Render an interactive line graph that includes a slider that allows you to adjust what's displayed on it. Include an (animated) picture of the line graph in the specification.