Log in to submit your own samples!
Plot a Line Graph
Problem by oml1111
| # | Likes | Tech tags | Title | Creator | Created date |
|---|---|---|---|---|---|
| 1 | 0 |
Matplotlib
|
2022-08-13 00:10
|
||
| 2 | 0 |
Plotly
|
2022-12-15 21:37
|
||
| 3 | 0 |
Bokeh
|
2022-12-15 21:12
|
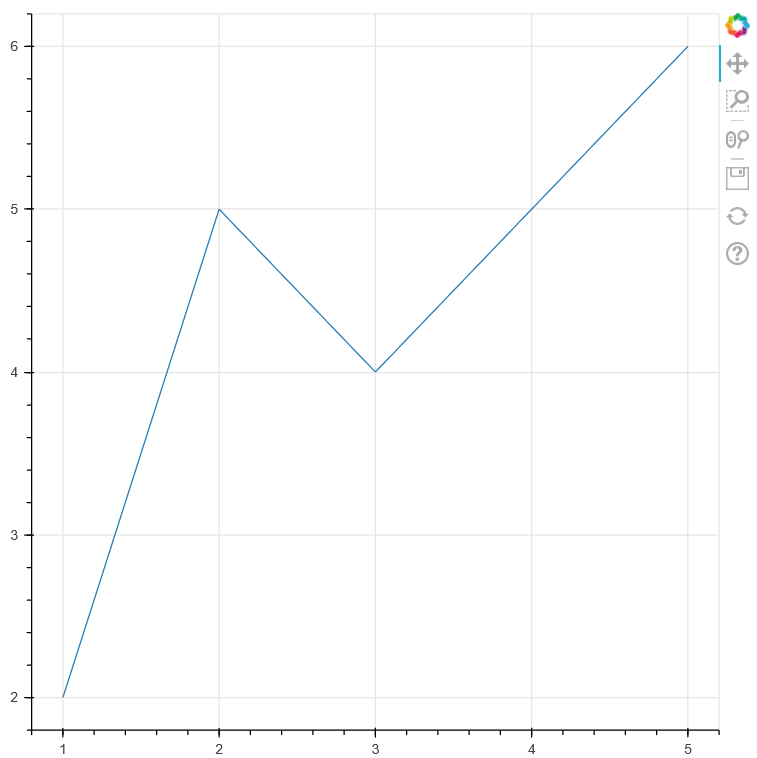
Renders the following interactive line graph:
Code
from bokeh.plotting import figure
from bokeh.io import show

p = figure()
p.line([1, 2, 3, 5], [2, 5, 4, 6])

show(p)
Further reading
References
| classes | |
bokeh.plotting.figure |
docs.bokeh.org |
| functions | |
bokeh.io.show |
docs.bokeh.org |
bokeh.plotting.figure.line |
docs.bokeh.org |
Problem Description
Render a line graph. Include a picture of the line graph in the specification.