Log in to submit your own samples!
Plot a Line Graph
Problem by oml1111
| # | Likes | Tech tags | Title | Creator | Created date |
|---|---|---|---|---|---|
| 1 | 0 |
Chart.js
|
2022-12-16 04:23
|
||
| 2 | 0 |
Plotly.js
|
2022-12-16 03:45
|
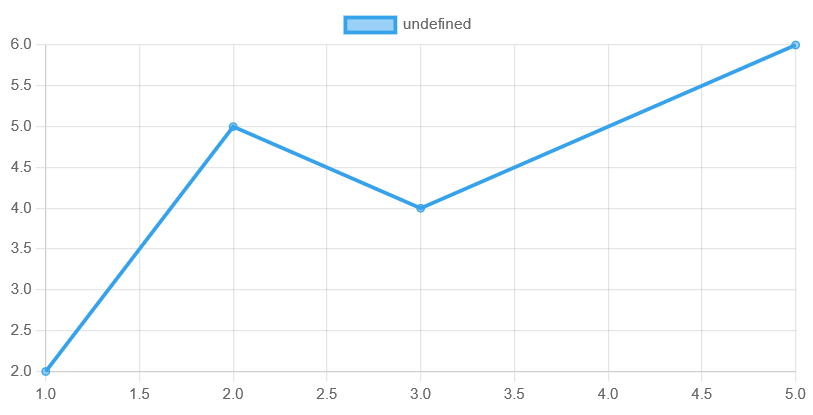
Renders the following line graph:
Code
chartjs.html
<head>
    <script src="https://cdn.jsdelivr.net/npm/chart.js"></script>
</head>

<body>
    <canvas id="plotDiv"></canvas>
    <script src="chartjs_code.js"></script>
</body>
chartjs_code.js
new Chart("plotDiv", {
type: 'line',
data: {
  datasets: [{
    data: [{x:1, y:2}, {x:2, y:5}, {x:3, y:4}, {x:5, y:6}],
  }]
},
options: {
  scales: {
    x: {
        type: 'linear',
    }
  }
}
});
Further reading
References
| classes | |
Chart |
chartjs.org |
Problem Description
Render a line graph. Include a picture of the line graph in the specification.